This article is part 1 of the Natvis-like experience with GDB pretty printers series:
Over the years of working on TheDarkMod game, we have amassed 1K lines of natvis code, 95 type definitions in total. Natvis has become an inherent part of good debugging experience, but it is available only on Windows. This story is about my attempt to extend this experience to the Linux side.
This multipart article explains how to reimplement most of the inherent natvis features on top of GDB pretty printers, provides a declarative approach to pretty printers similar to how natvis works, gives a solid deep-printing implementation similar to that of MSVC, and discusses the major issues of GDB value inspection.
TheDarkMod
TheDarkMod is the game started off the Doom 3 engine, which was made in years 2000-2004. Thus, the codebase has some properties which might seem unconventional for many C++ programmers:
-
Not Invented Here is a norm in gamedev. STL was not used by Doom 3, so custom containers are used almost everywhere in the code:
idListinstead ofstd::vector,idStrinstead ofstd::string, etc. -
C with classes is the general way of doing things, some parts of the renderer code were inherited from the older idTech engine and are in pure C. It is very typical to see intrusive linked lists with the
nextpointer being an explicitly declared member of a class. -
Entity hierarchy is a wide inheritance hierarchy containing all kind of game objects. Entity-Component-System architecture was not known yet.
idEntitybase class has 49 directly derived classes. It is also a god object: 109 direct members and sizeof = 2376 bytes.
Here are some links to the code:
- sys/msvc/natvis: the original natvis definitions for MSVC
- sys/linux/gdbpp: work-in-progress GDB pretty printers
- sys/linux/gdbpp/tdmuc_base.py: most of the code described in this article is in this file
Debugger selection
My first idea was to just use a debugger which supports natvis, since a few of them claim to have such a support. But I was quickly disappointed:
-
VS Code properly supports natvis only with Visual C++ debugger (reference). A limited portion of natvis is supported on Linux in MIEngine, implemented on top of GDB MI. It does not work well, and hangs up all the time.
-
CLion supports natvis only on Windows + MSVC toolchain (reference). Interestingly, natvis support has been implemented in a fork of LLDB. Some work is being done to extend it to Linux (issue), but it was not there when I looked into it.
So I started looking at alternative frameworks for customizing value visualization in the debugger:
-
GDB pretty printers is the Python framework native to GDB. So it is supported in CLion, VS Code, and many more IDEs, as long as they run on top of GDB.
-
LLDB data formatters is a similar Python framework native to LLDB. Supposedly supported by most IDEs as long as LLDB debugger is used.
-
QtCreator debugging helpers get an honorable mention. It is also a Python framework that works mainly in QtCreator. Since recently, it is also supported by CLion (reference).
I quickly discarded QtCreator options since it would tie us to a relatively unpopular IDE, and decided to pick either GDB or LLDB depending on which of them feels better. I gave up on LLDB data formatters after I realized that even enumerating the elements of an array requires non-trivial code with manual address computation and many interactions with the LLDB type system (see e.g. QVector formatter).
The main problems of all the natvis alternatives are: steep learning curve and high cost of error. Natvis is very compact and easy to use: after looking at a few examples you are ready to go. If you screw up, you'll see the raw data members in the Watch, and an error message in natvis diagnostics. But these alternative frameworks require you to know Python and have extensive API documentation. A lot of useful behavior which is provided out of the box in natvis is missing in GDB, so you have to implement it yourself in Python. And if you mess it up, you can easily get frozen GDB. And diagnostics are not always easy to get: exceptions and stdout messages can be silently swallowed or delayed.
Example
Here is an example of natvis for a typical std::vector-like container:
<Type Name="idList<*>">
<DisplayString>[{num}] {list,[num]na}</DisplayString>
<Expand>
<ArrayItems>
<Size>num</Size>
<ValuePointer>list</ValuePointer>
</ArrayItems>
</Expand>
</Type>
And here is its equivalent in GDB pretty printers (without registration code):
class idListPrinter:
    def __init__(self, value):
        self._value = value

    def display_hint(self):
        return 'array'

    def to_string(self):
        n = int(self._value['num'])
        return '[%d]' % n

    def children(self):
        n = int(self._value['num'])
        pArr = self._value['list']
        for i in range(n):
            yield (str(i), pArr[i])
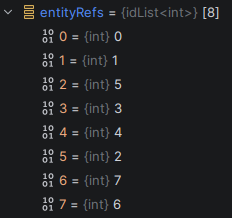
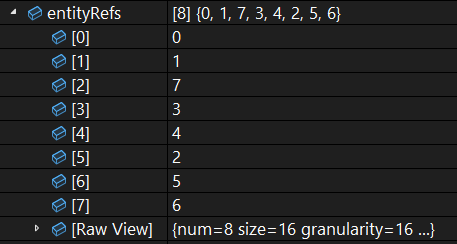
Here is how it looks in MSVC and CLion:
They are not strictly equivalent though, because the GDB version lacks some noticeable features:
- The natvis version displays a few first elements straight in the display string, so often I see the contents without even having to expand it. And it does not hang while doing so.
- The natvis version has a special
[raw]child, which contains all the raw members of the class. It is useful on the rare occasions when I want to see capacity or address of the array.
After a lot of hard work, I have managed to implement both of these features on top on GDB pretty printers.
Inspection model
One thing in common between all the frameworks is that you basically customize two things for each type:
- Display string or summary: a short plain text that you see instead of the value of the variable.
- Children: the list of children inside variable, each children having a name and a value.
At the beginning, I hoped that correct GDB pretty printers would work in any debugger that runs on top of GDB, but I turned out to be wrong! In fact, most of the IDEs I tested don't work properly, which I believe is caused by the clash between two different value inspection models:
-
Lazily expanded tree. You see display string for the value. You can click the value to expand it and see its children. Then you can click on some children to expand them further, etc. Very similar to a typical filesystem browser. This is how GUI debuggers normally work.
-
Deep printing. You print out the display string of the value, then enumerate all of its children and recursively print them out. As the result, you see the complete contents of the value as one long text. This is how command line debuggers normally work, since they lack mouse interactions.
Deep printing model has one major problem: it can often traverse/print too much. If the children tree has cross-links, then the output can grow exponentially. If the children graph has loops, then deep-printing hangs completely. One can avoid such issue by forbidding to expand a child of pointer/reference type, but such a limitation makes value inspection useless in most applications. Even filesystems today are not trees because of all the directory links! GDB employs simple remedies like limiting print depth and width, but they are not reliable: imagine a large array and a large binary tree, where every element contains an expandable pointer to the root.
This becomes an ever-present pain with GDB pretty printers. Deep-printing model is so ingrained into the GDB mindset, it is very easy to invoke it accidentally, either by writing pretty printers incorrectly, or by doing something wrong on IDE side. Scrupulously following the lazy expansion model depends on the specific IDE debugger and is not guaranteed by the GDB itself.
Interestingly, this is specifically a GDB problem. Deep printing can be safe and fast if done properly. MSVC debugger does since forever: it deep-prints every value that misses a custom natvis DisplayString. I have also implemented proper deep-printing on top of GDB API, as you will see in the auto-summary chapter.