It is well-known that Debug build in Visual C++ is very slow compared to Release build, with the typical ratio about 10-20 times. Various reasons behind it are often stated, and some people even believe that it is inevitable because it is caused by lack of compiler optimizations.
If some issue happens only on a large dataset or in a real-time application, and it cannot be extracted into a smaller test case, then developer is forced to debug Release build. Which is rather painful experience, because debugger has problems showing control flow, values of local variables, sometimes even currently executed function, since all these concepts are messed up by optimizations. Ironically, the more optimizer-friendly your code is, the worse would be your experience of debugging Release build =)
Luckily, Visual C++ provides a lot of settings for tuning speed-vs-comfort ratio. It is entirely possible to create a "Fast Debug" configuration which works only a few times slower than Release yet is pretty easy to debug due to lack of optimizations.
Settings
Below you can see three pieces of advice which can greatly improve performance of Debug build. Of course, none of these improvements are free: with every change you lose some nice debug helper, so don't throw away the full Debug build yet.
Basic Runtime Checks
Disable either Basic Runtime Checks or Edit And Continue. If you want to know why it becomes slow, I recommend reading the full investigation by Bruce Dawson. But the bottom line is that having both of these settings causes a huge slowdown.
Unfortunately, both settings can be useful:
-
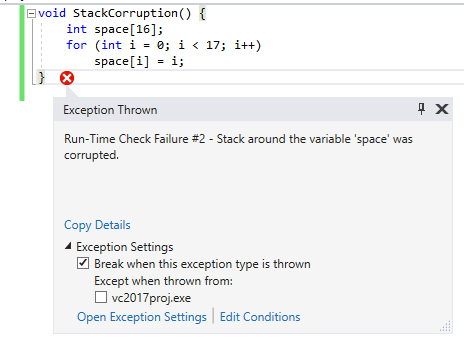
With Basic Runtime Checks enabled, debugger detects stack corruption. Such a hazard happens e.g. when a local array is modified out of bounds. There are other features included too, but this one seems to be the most useful, and you lose it if you disable the checks. Some stack errors will still be caught by Buffer Security Check, which is enabled even in Release, but without certainty.
-
Edit and Continue allows to pause program execution, edit the source code, update the build, and continue execution without restarting the application. This is especially useful in gamedev, as seen from the list of Live++ clients. The built-in MSVC implementation is not very reliable, but it nevertheless proved useful in TheDarkMod development.
In VC project, the Runtime Checks setting can be found in: C/C++ -> Code Generation -> Basic Runtime Checks. By default, the checks are enabled in Debug build, adding /RTC1 command line switch. Choose "Default" in drop-down list to disable it.
Speaking of "Edit and Continue", it is also enabled by default in Debug configuration. It can be found in: C/C++ -> General -> Debug Information Format. It generates /ZI compiler argument when enabled, and /Zi argument when disabled. Choose "Program Database" in drop-down list to disable it.
In CMake-generated project, the checks are also enabled by default. But as it often happens with CMake, the setting is not exposed. The simplest way to disable it is to remove it from compiler global parameters:
string(REPLACE "/RTC1" "" CMAKE_CXX_FLAGS_DEBUG "${CMAKE_CXX_FLAGS_DEBUG}")
The "Edit and Continue" feature is disabled by default in CMake-generated projects. You have to do additional work if you want to enable it, but that's outside the scope of this article.
Inlining
Enable inlining level 1 (\Ob1).
It allows VC compiler to inline calls to functions which are considered 'inline' according to C++ language rules. Function calls are cheap as far as I know, but inlining matters a lot for good performance because it allows to optimize the code much better (since optimizer operates on per-function basis).
However, limited inlining helps without generic optimizations too. In most cases, only tiny functions and functions marked forceinline are inlined with /Ob1, so it does not harm debugging. But keep in mind that sometimes it can inline a function you want to debug.
The /Ob1 settings was enabled in "Debug with Inlines" configuration in Doom 3 source code. It is still used in TheDarkMod. It boosts FPS without noticeable drawbacks.
By default, both VC project and CMake completely disable inlining in Debug build (/Od). In VC project you can find the setting in: C/C++ -> Optimization -> Inline Function Expansion. Choose "Only __inline" from drop-down list to enable it, resulting in /Ob1 compiler argument. In CMake the easiest way to enable it is to add a global compiler parameter, although it can also be done on per-file basis:
# globally:
set(CMAKE_CXX_FLAGS_DEBUG "${CMAKE_CXX_FLAGS_DEBUG} /Ob1")
# for specified source files:
set_source_files_properties(${sources} PROPERTIES COMPILE_FLAGS "/Ob1")
By the way, CMake uses /Ob1 by default in its RelWithDebInfo configuration. In order to get full Release build with CMake, one has either to enable /Ob2 manually on RelWithDebInfo build or to enable debugging information in Release build.
Version of CRT
Use Release version of C Runtime Library.
Doing so in debug build is rather questionable idea. Depending on CRT version, compiler sets _DEBUG define and enables/disables iterator debugging. Hence, ABI usually depends on CRT version, i.e. you cannot link together object files compiled against debug and release versions of CRT. Except if you write in pure C or avoid STL completely: in such case you can link debug and release code.
The immediate consequence of ABI change is that you are forced to use release builds of prebuilt libraries if you use release CRT. But this is not necessarily a problem, since in most cases you don't have to debug third-party libraries. Quite the opposite, using release libraries allows you to greatly accelerate your debug build if the program spends much time in them. Perhaps "Unoptimized Release" would be better name for such configuration than "Fast Debug" though.
Other downsides of using release CRT are:
-
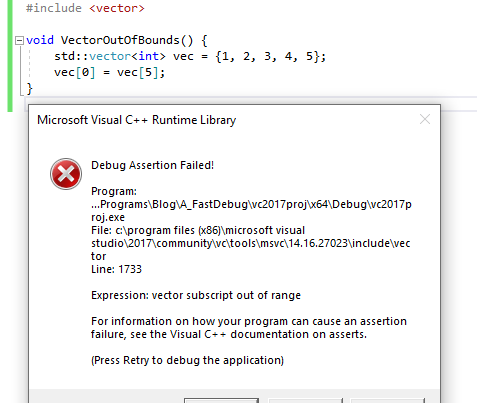
No more iterator debugging. Most importantly, using
std::vector<T>::operator[]with index out of range won't trigger any error. You are lucky if you use your own containers instead of STL, because you can still have an assert in youroperator[]for a very low performance cost. You will lose even more debug checks if you love putting STL iterators everywhere (I don't care since I prefer indices to iterators). -
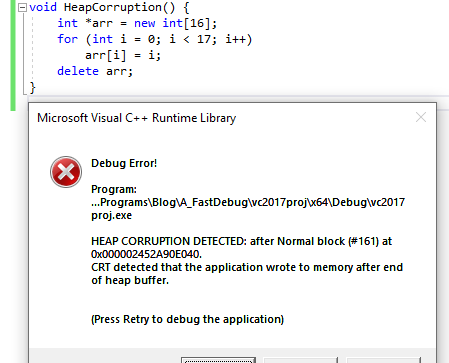
Heap corruption check gone. This check allows to detect writes to heap block outside of its bounds. Without the check, the heap would probably break anyway, but it would happen later and diagnostic message would be less helpful.
Both in VC project and in CMake-generated project, debug CRT is used for Debug build by default. More precisely /MDd argument, which means "Multithreaded Debug DLL". In VC project settings, it can be found in C/C++ -> Code Generation -> Runtime Library. Choose "Multi-threaded DLL" in drop-down list to switch to release CRT (which is /MD).
Changing the setting in CMake is more difficult. One way is to replace global compiler argument:
string(REPLACE "/MDd" "/MD" CMAKE_CXX_FLAGS_DEBUG "${CMAKE_CXX_FLAGS_DEBUG}")
More correct approach is to use the new MSVC_RUNTIME_LIBRARY property, but it did not work for me.
Benchmark
A piece of code working with small std::vector is shown below. Note that you should avoid making small local vectors for good performance. Better use local array, vector-like container which can be linked to local buffer, or custom allocator. This test is ill-written, and stresses low-level performance, heap operations, and methods inlining. All the performance issues are severely magnified, so don't expect the same gains on a real program.
//almost all the time is spent in this function (in.size() == 5)
static NOINLINE int OrderSum(const std::vector<int> &in) {
    std::vector<int> sorted;
    sorted = in;
    int n = sorted.size();
    for (int i = 0; i < n; i++)
        for (int j = 0; j < i; j++)
            if (sorted[i] < sorted[j])
                std::swap(sorted[i], sorted[j]);
    int res = 0;
    for (int i = 0; i < n; i++)
        res += sorted[i] * (i+1);
    return res;
}

int64_t GlobalSum;
void FullTest() {
    static const int SIZE = 5;
    std::vector<int> vec;
    for (int i = 0; i < SIZE; i++)
        vec.push_back((i*3)%5 + i);
    for (int q = 0; q < 1000; q++)
        GlobalSum += OrderSum(vec);
}
The call of FullTest is wrapped into a large loop executed for at least one second. The total time is divided by total number of OrderSum calls, obtaining the average time spent per one OrderSum call. Default project was created in VC2017, x64 Debug configuration is used with only the explicitly stated modifications. The program is run 3 times under devenv with debugger attached, median time is recorded. Ryzen 1600 CPU is used.
| E&C disabled | /RTC disabled | /Ob1 enabled | release CRT | result |
|---|---|---|---|---|
| no | no | no | no | 20700 |
| yes | no | no | no | 7321 |
| no | yes | no | no | 3565 |
| yes | yes | no | no | 3491 |
| no | no | yes | no | 4278 |
| yes | no | yes | no | 2455 |
| no | yes | yes | no | 1379 |
| yes | yes | yes | no | 1339 |
| no | no | no | yes | 10716 |
| yes | no | no | yes | 3596 |
| no | yes | no | yes | 1617 |
| yes | yes | no | yes | 1693 |
| no | no | yes | yes | 848 |
| yes | no | yes | yes | 506 |
| no | yes | yes | yes | 268 |
| yes | yes | yes | yes | 268 |
| [release] | 86 |
Some conclusions from the raw data:
-
If you have already disabled Runtime Checks, then disabling Edit and Continue yields no additional performance improvement.
-
Disabling Edit and Continue is less helpful than disabling Runtime Checks (about 2x difference in time).
-
Aside from correlation between Edit and Continue and Runtime Checks, all settings are more or less independent.
-
Disabling Runtime Checks improves performance in 6x times without inlining, and in 3x times with inlining.
-
Inlining accelerates the code in 3x times without release CRT but with Runtime Checks disabled.
-
Release CRT makes the code faster in 2x times, given that inlining is disabled.
-
Release CRT and inlining have major synergy, providing impressive x14 boost together when Runtime Checks are disabled.
-
Default Debug build is x240 times slower than default Release build. With all the aforementioned settings enabled, Fast Debug build is only x3 times slower than Release build (and that's with optimization still disabled!). The total improvement of Fast Debug over default Debug is 77x times.
I hope this example ruins the myth that Debug build is slow because it lacks optimization, and that two-digit slowdown is inevitable. Indeed, you still need Debug build to simplify debugging all the nasty issues, but I think Fast Debug build should be the default one used for debugging.
UPDATE: Since Visual Studio 2019, functions are never inlined when Edit and Continue is enabled. The measurements above were done on VS 2017. There is no way to make /Ob1 inlining work with Edit and Continue in VS 2019 and 2022.
Localized tuning
If debug speed really matters to you, you shouldn't stop at tweaking global settings. In most cases there are few places in the program which waste considerable amount of time. Usually these places are well-written and are almost never touched with debugger. If a bit of code spends time but does not need to be debugged, it's better to enable optimization on it locally.
Third-party libraries
A common case is when performance-heavy code is inside a prebuilt library. You don't want to debug that library, so it would be great to use its release version in your debug build. There are several ways to achieve it:
-
If it is a pure C library or a C++ library without STL, then its release version can be linked with debug code statically. If it contains any of the STL, then you won't be able to do this due to settings mismatch (iterator debugging and CRT version). Otherwise you can link it even if it was compiled with release CRT and the rest of the code uses debug CRT. A warning about the mismatch can be muted.
-
You can build the library as DLL with CRT statically linked in. This DLL can be used in any application, as long as the exported interface contains no STL and does not pass heap allocations across DLL boundary. If any of this happens (it almost certainly happens for a heavy C++ library), then you cannot use this approach. Perhaps there are more restrictions here, e.g. you should not print to console both in the DLL and in your application. That's the typical pain from having several CRTs in a program.
-
Finally, you can switch your code to release CRT, as suggested above. Then you will have to link release versions of all third-party libraries, although this is not a problem in most cases. And you will lose the benefits of debug CRT of course.
Pragma optimize
The other case is a performance-heavy piece of your own code. Let's assume it is so heavy and polished, that it can be kept optimized even in debug. There are two ways to do this:
-
Enable optimization on a single translation unit, i.e. on cpp file. It can be done both in the VC project file and in CMake. This approach has limited flexibility.
-
Enable optimization on a few functions. This can be done with #pragma optimize directive.
Let's concentrate on the latter. An important thing to know is that #pragma directive can be used inside macros in its __pragma form, so it is possible to wrap optimization pragmas into macros which are enabled depending on compiler and configuration:
#if defined(_MSC_VER) && defined(OPTIMIZE_DEBUG)
  //force optimization of this code section in special debug configuration
  #define DEBUG_OPTIMIZE_ON __pragma(optimize("gt", on))    //enable optimizations
  #define DEBUG_OPTIMIZE_OFF __pragma(optimize("", on))     //reset optimization settings
#else
  #define DEBUG_OPTIMIZE_ON
  #define DEBUG_OPTIMIZE_OFF
#endif
Optimization can be force-enabled for a bunch of functions like this (excerpt from TheDarkMod):
DEBUG_OPTIMIZE_ON
void R_GlobalPlaneToLocal( const float modelMatrix[16], const idPlane &in, idPlane &out ) {
    out[0] = DotProduct( in, &modelMatrix[0] );
    out[1] = DotProduct( in, &modelMatrix[4] );
    out[2] = DotProduct( in, &modelMatrix[8] );
    out[3] = in[3] + modelMatrix[12] * in[0] + modelMatrix[13] * in[1] + modelMatrix[14] * in[2];
}
DEBUG_OPTIMIZE_OFF
There are several details to keep in mind:
-
I suggest creating a special macro flag
OPTIMIZE_DEBUGfor this tweak, since there is no predefined macro showing optimization level or build configuration. The macro_DEBUGis usually defined when debug CRT is used, so it will be missing if you switch your Debug build to release CRT. The macroNDEBUGonly affects removal of asserts. -
Be sure to close the section of force-optimized code with
DEBUG_OPTIMIZE_OFF, otherwise the rest of cpp file will become surprisingly hard to debug. -
The tweak has no effect on template and/or inline functions. One cannot just surround the body of such function and think it will be optimized. Because template functions are compiled when they are instantiated (this usually happens implicitly), and inline functions are compiled as the part of the function they are inlined into (at least optimization matters at this moment). It shouldn't confuse people who know how machine code is generated.
-
Function calls are rarely inlined in debug builds, even if
/Ob1is enabled (and absolutely never if it's disabled). One way to workaround the issue is to use macros instead of inline functions. The other way is to mark small accessors with __forceinline keyword (wrapped in a cross-platform macro of course).
Given that it is easy to make a mistake with this approach, I recommend generating assembly output with /FAs and checking it. Verify that optimization is applied as expected to functions, and that there are no non-inlined function calls in optimized sections. Optimized functions are preceded with the following line in VC assembly listing:
; Function compile flags: /Ogtp
Non-optimized functions have:
; Function compile flags: /Odtp /ZI
The key difference here is /Og against /Od.
This is not the most clean and easy-to-use technique, but it can be helpful sometimes. For instance, the original Doom 3 engine contains a set of SIMD routines written in assembly. The most performance-critical of these routines are used every frame to compute animations and stencil shadows of dynamic meshes. Yeah, that's CPU-side shadows and animation, greetings from year 2004 =) These routines had to be rewritten with intrinsics in order to accelerate 64-bit build of TheDarkMod, since assembly is locked in 32-bit. One weak point of intrinsics is that they are quite slow in Debug. So optimization was force-enabled on all the SIMD routines in the "Debug with Inlines" configuration.
Conclusion
All the materials used for benchmark are available in this repo.
I'd like to mention the article Fifty shades of debug by Mathieu Ropert here. It contains many ideas similar to the ones presented in this article.